GBP/USD technical analysis: 4-week old resistance-line restricts short-term bulls
- Immediate trend-line resistance challenges the GBP/USD pair’s break of 21-DMA.
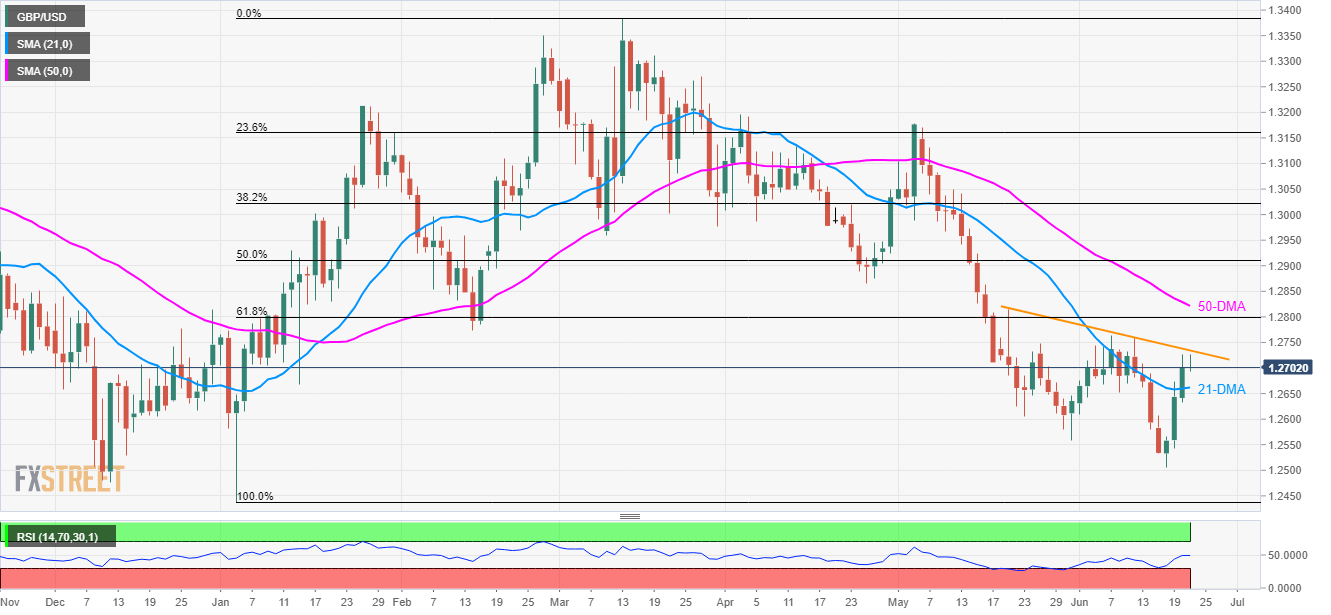
- 61.8% Fibonacci retracement and 50-DMA seem on buyers radar past-1.2735.
Even if the successful break of the 21-day moving average (DMA) propels the GBP/USD pair to more than a week’s high, 4-week old descending trend-line presently limits the upside as the quote seesaws near 1.2700 ahead of the UK open on Friday.
Should the quote manage to clear 1.2735 resistance-line barriers, 61.8% Fibonacci retracement of January – March upside at 1.2800 and 50-DMA level of 1.2822 can quickly appear on the chart.
Also, pair’s sustained trading above 1.2822 enables it to aim for April month low near 1.2865.
On the contrary, the 21-DMA level of 1.2662 acts as close support, a break of which can recall 1.2610 and 1.2560.
In a case where prices keep declining below 1.2560, present month low near 1.2506 and the year’s bottom around 1.2438 may please the sellers.
GBP/USD daily chart
Trend: Pullback expected